Introduction
Tableau is an excellent data visualization tool for turning raw data into interactive and shareable dashboards. It is a very simple drag-and-drop interface that packs together the tools to create different kinds of visual representations, from simple charts to complex dashboards-ready to be published on the web, used on sites, or shared among colleagues. In today’s era, the ability to analyze and visualize data is invaluable, and the Tableau platform provides such an opportunity.
Installation & Setup
Tableau is very easy to use. You can choose between Tableau Desktop, Tableau Public (free), or Tableau Online depending on your particular conditions. Follow this quick setup guide for Tableau Public:
1. Download Tableau Public:
 Visit the Tableau Public website and click on the “Download” button.
Follow the installer instructions to complete the setup.
Visit the Tableau Public website and click on the “Download” button.
Follow the installer instructions to complete the setup.
2. Installation Steps:
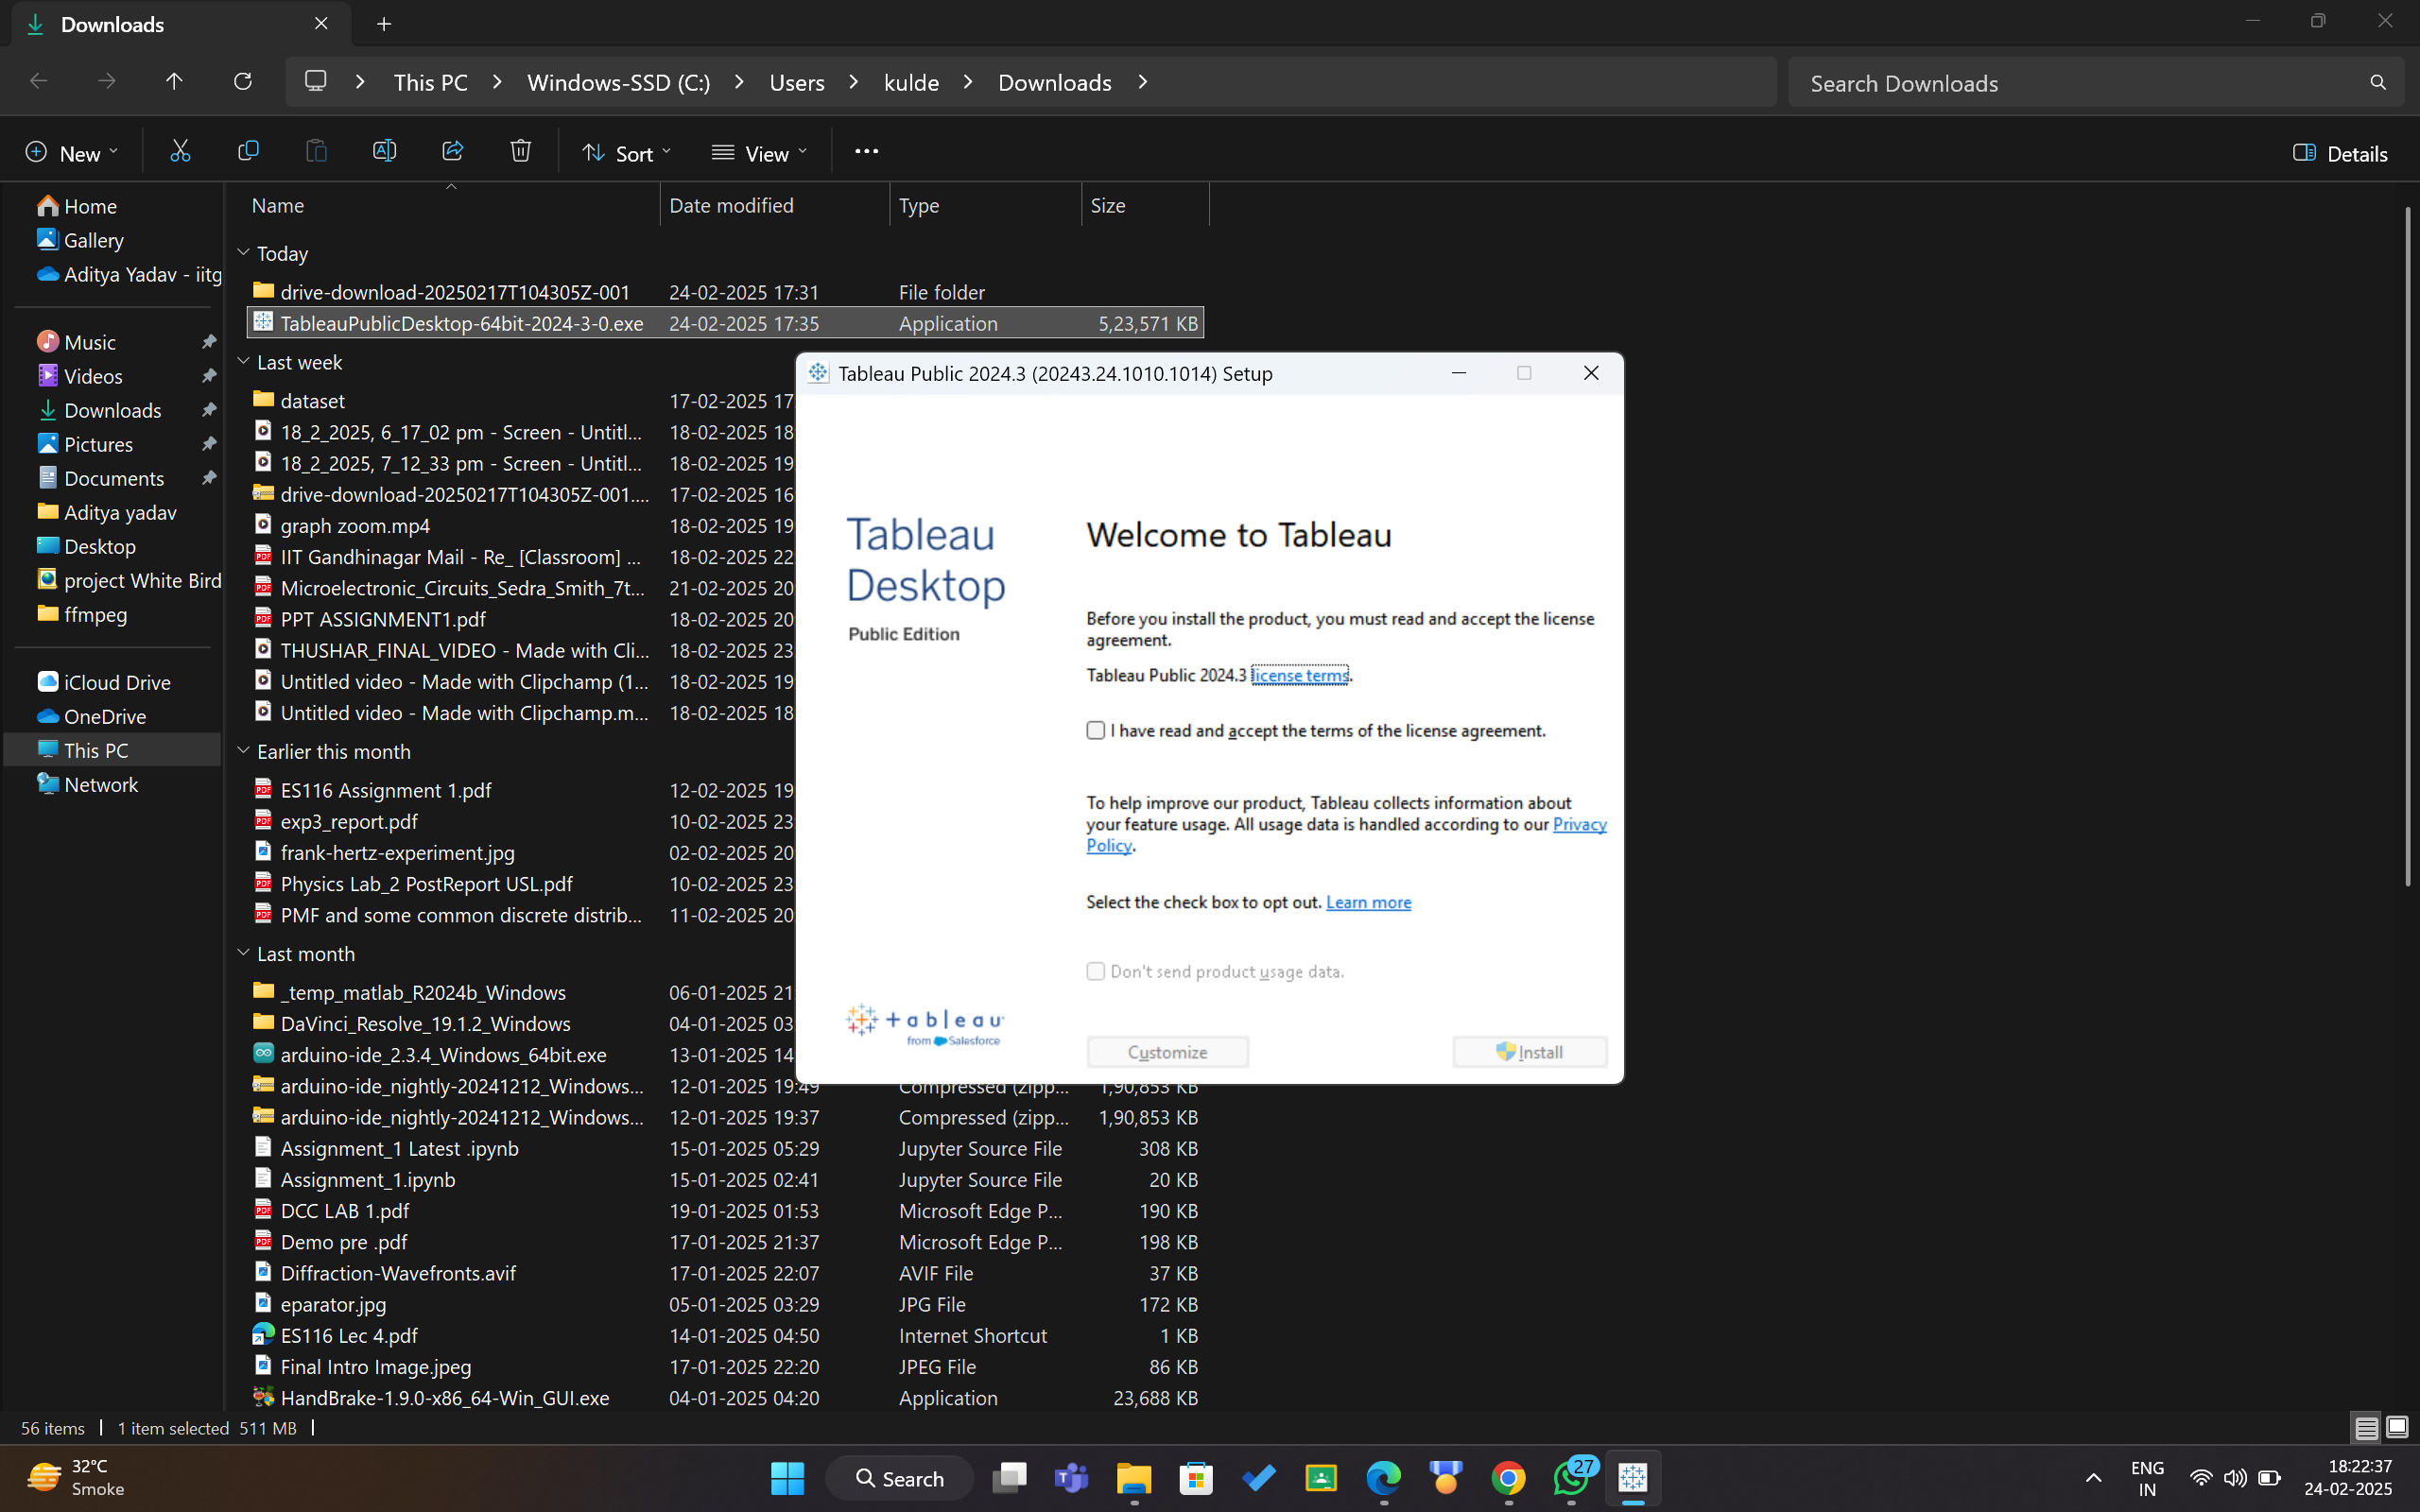 Run the downloaded installer.
Accept the license agreement.
Choose the installation location and complete the process.
Run the downloaded installer.
Accept the license agreement.
Choose the installation location and complete the process.
3. Initial Configuration:
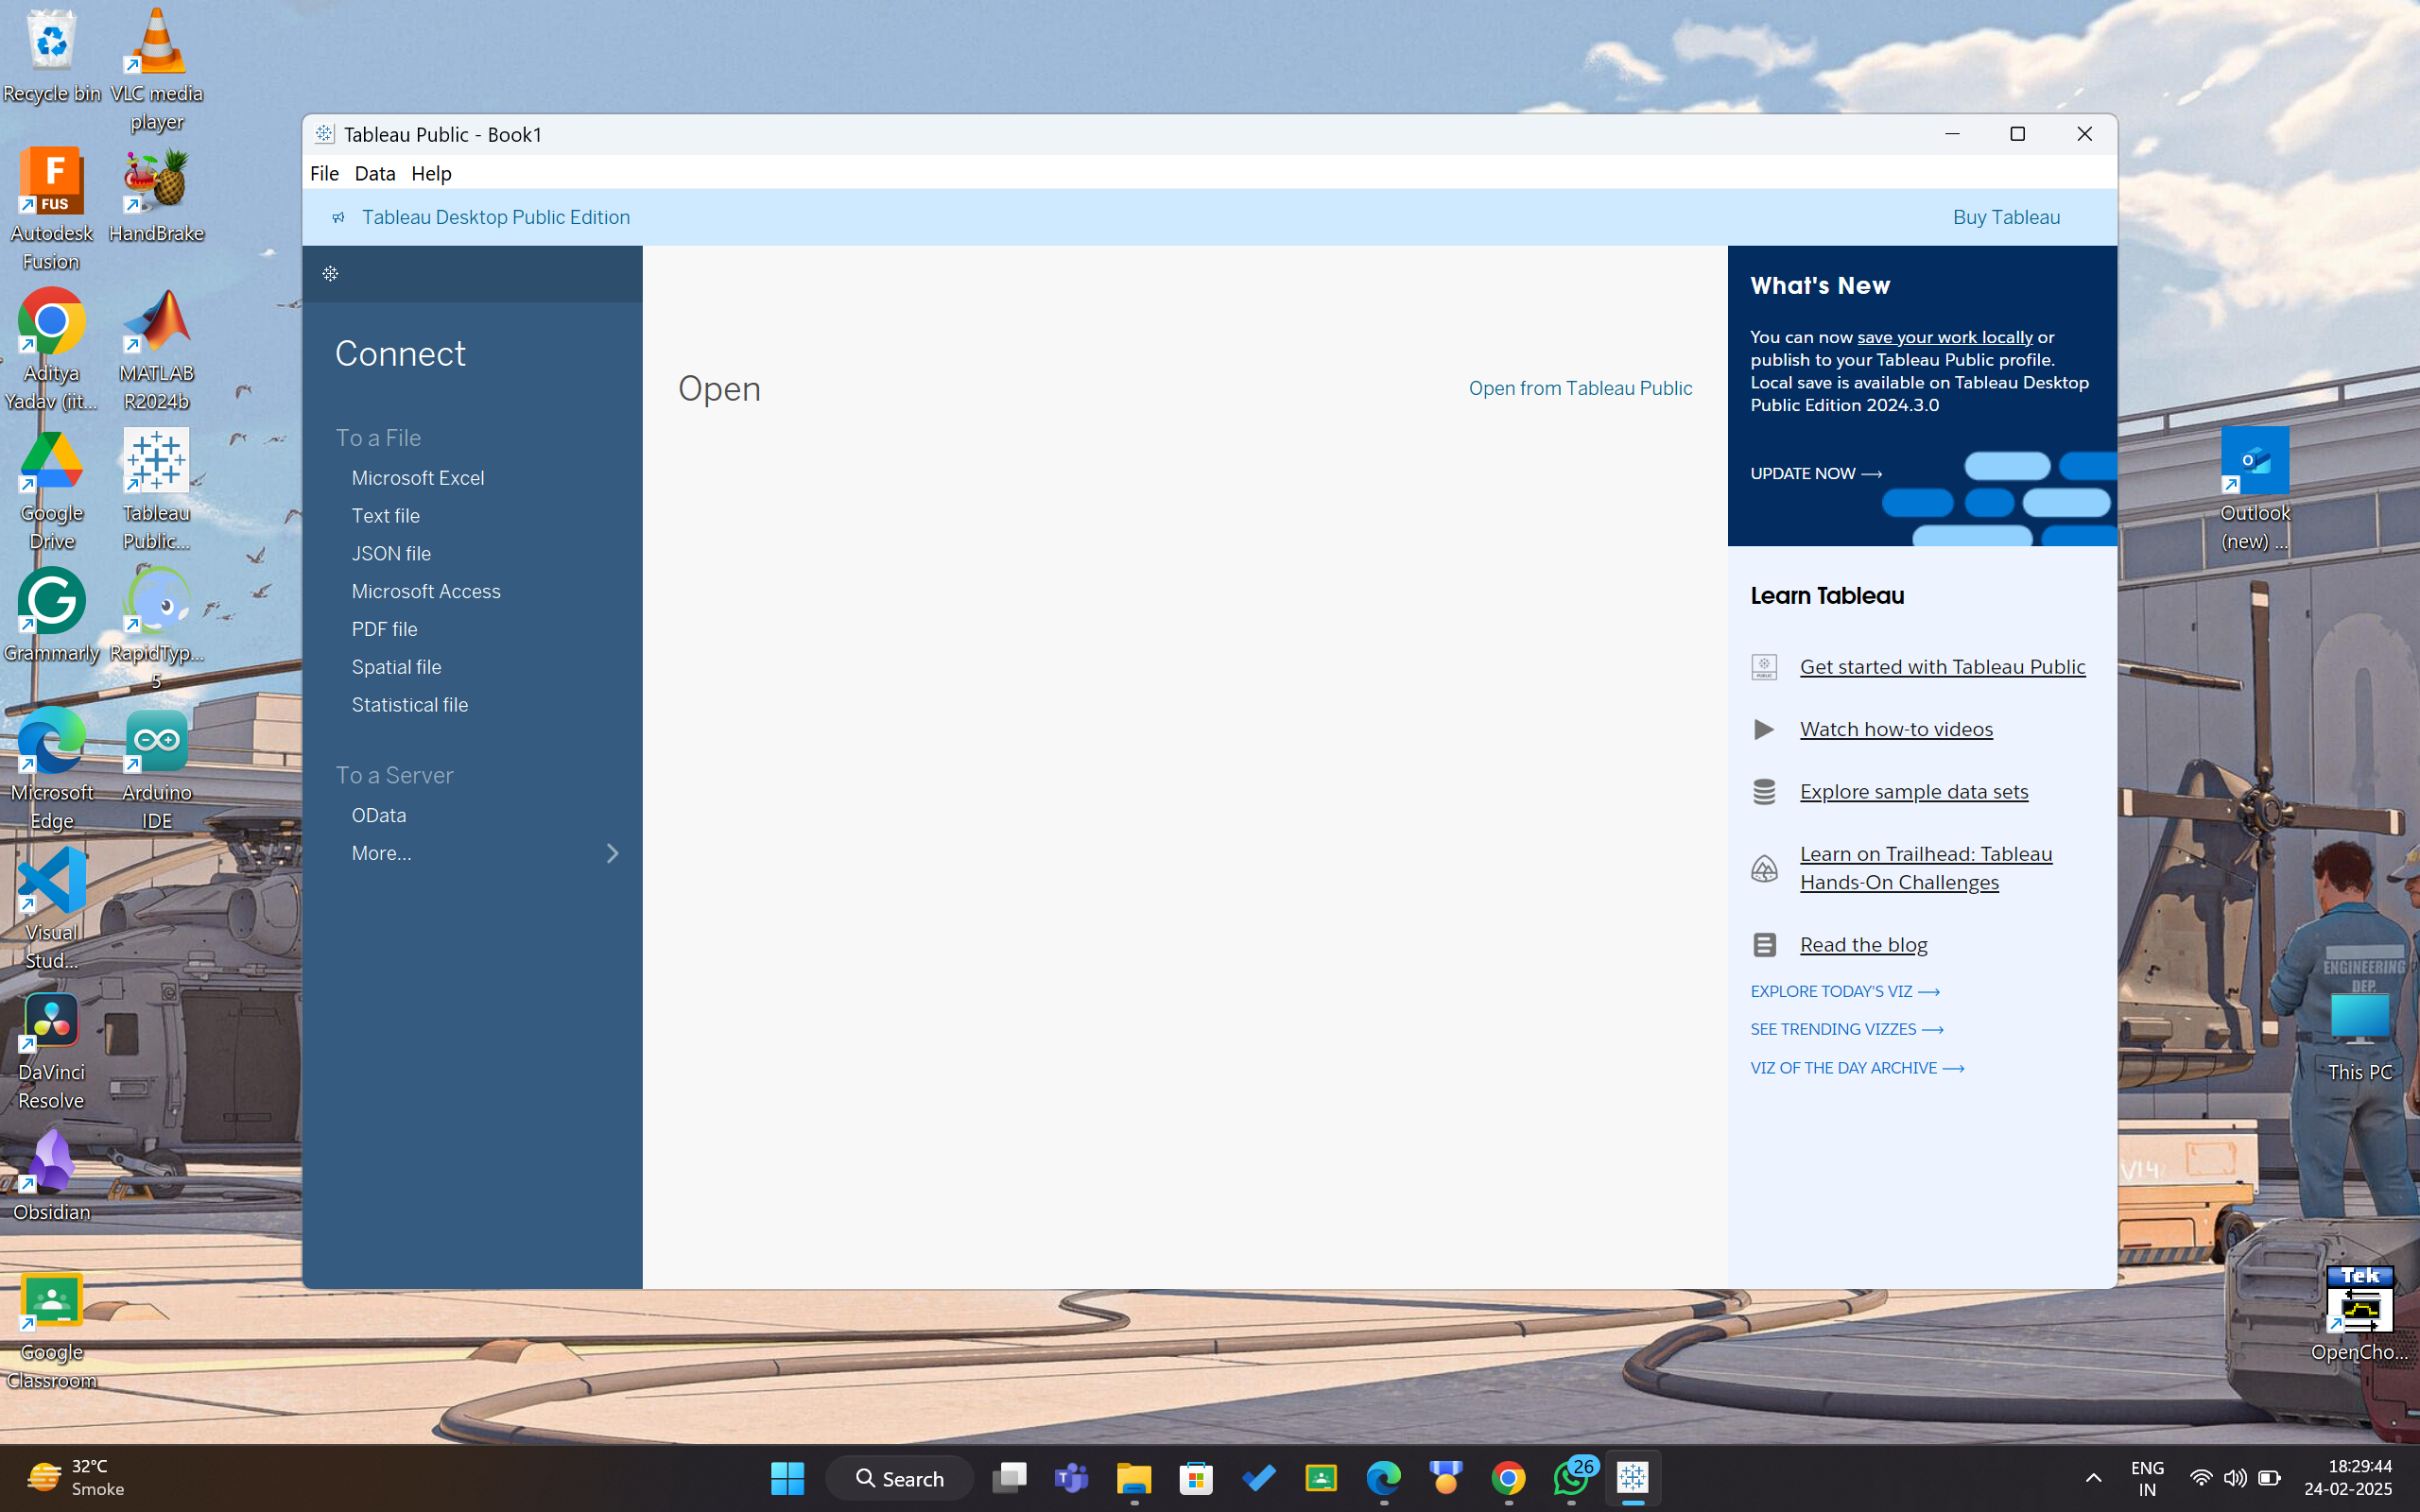 Launch Tableau Public after installation.
Sign in with your Tableau Public account (or create one if you haven’t yet).
Explore the sample dashboards available to get a feel for Tableau’s capabilities.
Launch Tableau Public after installation.
Sign in with your Tableau Public account (or create one if you haven’t yet).
Explore the sample dashboards available to get a feel for Tableau’s capabilities.
Key Features & Explanation
Tableau stands out because of its rich feature set. Here are some key functionalities:
Drag-and-Drop Interface: Create quick visualizations without having to write a single line of code!
Data Connectivity: Connect to various data sources, including Excel, SQL databases, and cloud services very easily.
Calculated Fields: Create custom calculations to derive insights from your data.
Interactive Dashboards: Create on-page interaction with multiple visualizations by combining them into a single dashboard.
Sharing & Collaboration: Publish dashboards on Tableau Public or Tableau Online and embed them in websites.
Code Examples
Though Tableau is GUI mode of operation, there are some moments when you can really benefit from coding for better functionality. Here are a couple of examples:
Example 1: Creating a Calculated Field
Calculated fields allow you to create new data metrics in Tableau. For instance, when you categorize sales as either ‘High’ or ‘Low’ based on a certain threshold:
tableau
IF [Sales] > 1000 THEN 'High'
ELSE 'Low'
END
Explanation: This computed field checks to see whether the value of the sale is over 1000 and assigns a label accordingly. This field can be used for charting in color or to filter data. Example 2: Integration of Python with Tableau via TabPy TabPy allows Tableau to interact with external services such as Python. For example, if you want to use a custom Python function applied to your data: tableau
SCRIPT_REAL(
  "import numpy as np
   return np.mean(_arg1)",
  SUM([Profit])
)
Explanation: This snippet sends the sum of profits to a Python script that calculates the mean using NumPy. To set this up, ensure you have TabPy installed and configured with Tableau.
Screenshots
Visual aids can significantly enhance understanding. Below are sample screenshots to illustrate important points:
Tableau Dashboard Example Screenshots
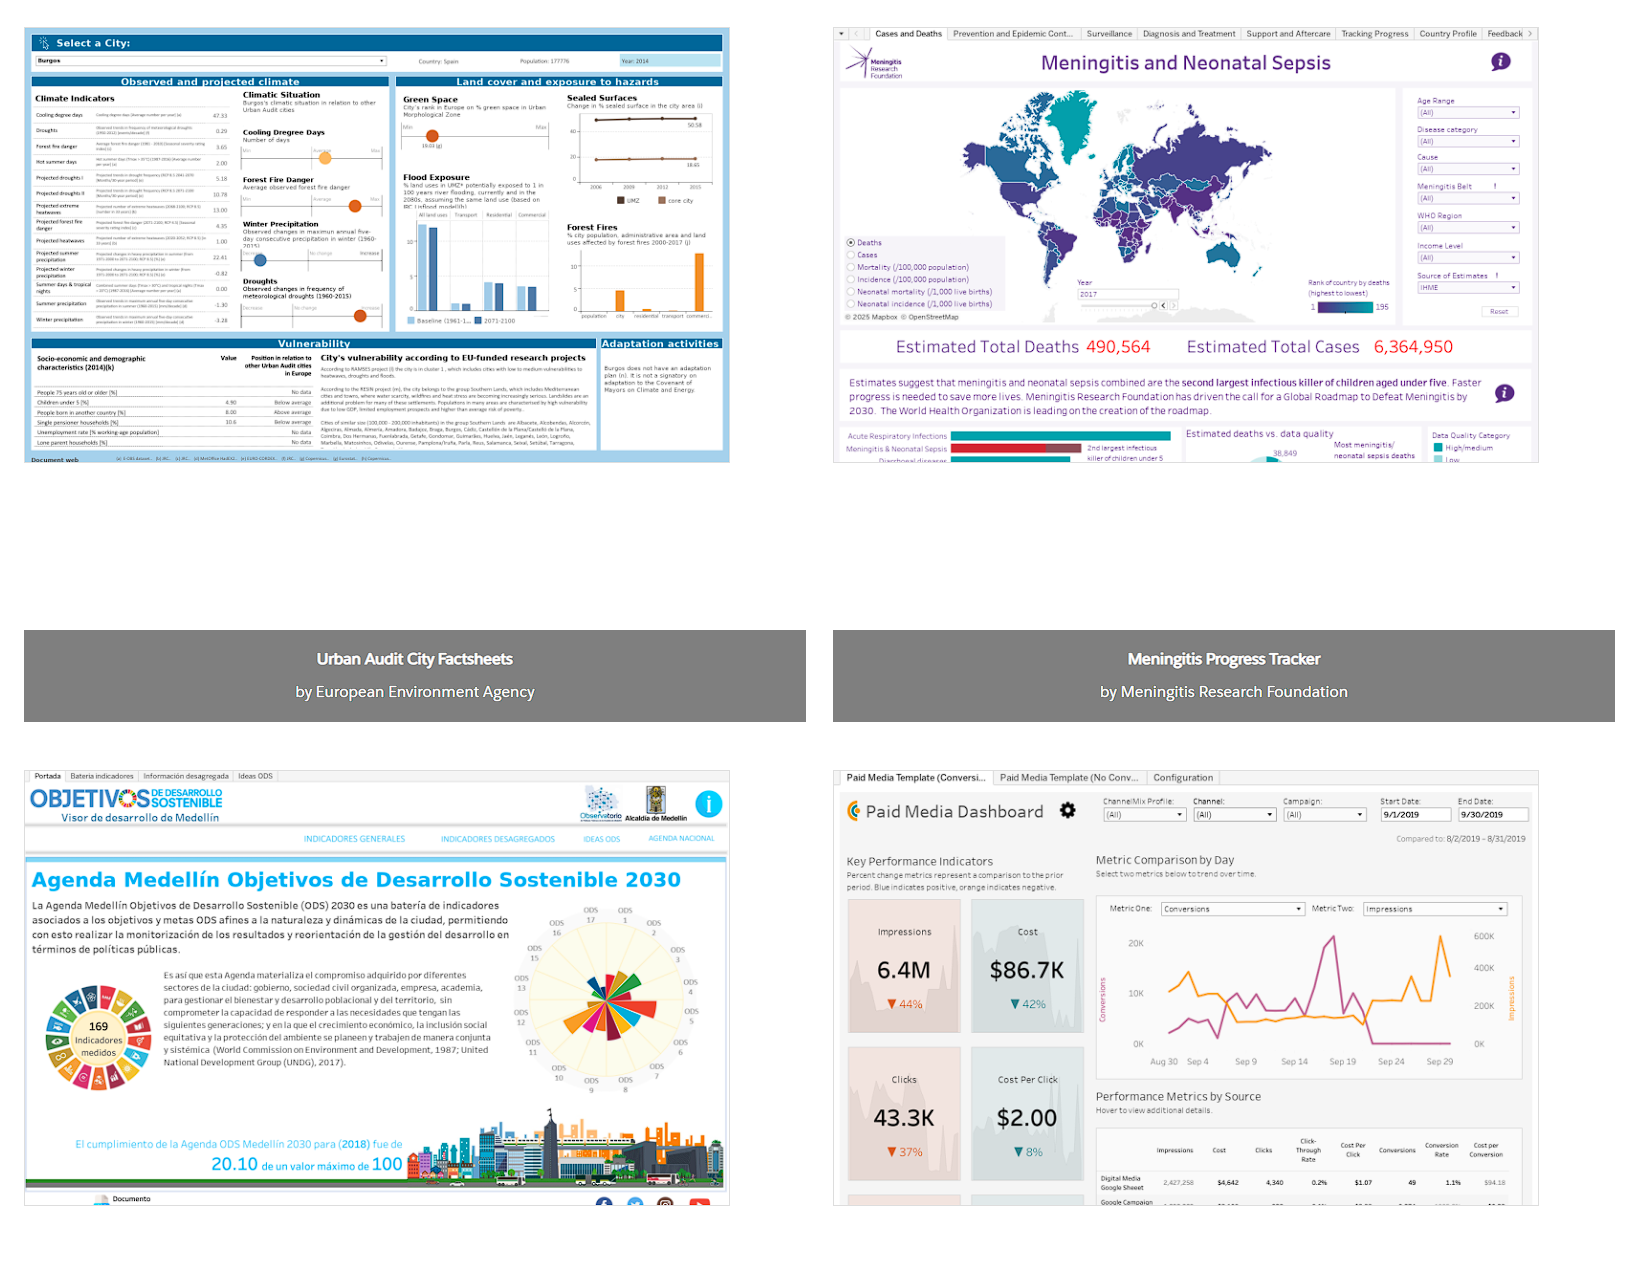
Figure 1: Sample interactive Tableau dashboards
Use Cases
Tableau operates in various sectors. Some common applications include:
Business Intelligence: Analyzing sales, revenue, points of customer preference.
Marketing Analytics: Campaign intelligence alongside ROI.
Healthcare: Visualizing patient data and monitoring resource allocation.
Finance: Observing and following market trends and risk management as well as portfolio performance.
Education: Studying enrollment data and metrics on academic performance.
Conclusion
Tableau enables users to make interactive and insight-driven visualizations from complex data. With easy installation, setup, and advanced integration with programming languages such as Python, Tableau is a robust tool for users that want to take their data analysis to a whole new level. From analysts to data scientists and business executives, Tableau provides the tools required for rapid, informed decision-making.
References & Further Reading
By following this guide and exploring the various features and capabilities of Tableau, you’re well on your way to mastering data visualization. Happy analyzing!